0 users browsing Discussion. | 4 guests | 5 bots
| Duck Penis |
Posted on 19-06-26, 13:41
|
|
Stirrer of Shit
Post: #444 of 717 Since: 01-26-19 Last post: 1910 days Last view: 1909 days |
Posted by wertigon Cool it with the personal attacks, will you? I did read the paper. Since we are trying to ascertain whether there indeed are intellectual differences, it doesn't form a cohesive argument to claim that since there aren't intellectual differences, there can't be differences in chess aptitude, and thus there aren't intellectual differences. This is just plain circular reasoning. Don't see the the relevance of the last bolded sentence. I wouldn't think girls drop out more than boys. I read appendix A, it seems like a needlessly convoluted method. Surely, if you have 100 numbers, no matter the distribution, and pick one at random, you will have a 1% chance of picking the highest number, assuming there is such a number. And from this it should follow that the highest number forms the 100th percentile. Or more formally, from a sample of n items from a distribution, the sample's highest value's expected position (e.g. cumulative likelihood of obtaining the value) within the parent distribution is 1-1/n. And if there are 10x as many male players as women players, then provided they are drawn from the same parent distribution, that should mean that nmale = 10nfemale. Then that would give the highest male player's expected relative position as 1-1/nmale, and the highest female player's expected relative position as 1-1/nfemale. And likewise, the second highest ranked player's as 1-2*(1/n) = 1-2/n, up to the nth highest ranked player's (e.g. the last ranked player's) as 1-n/n = 1-1 = 0. Perhaps more intuitively: If you have 100'000 people, half men and half women, and 10k of the men go on to play chess and get ranked and 1k of the women do so, then if you'd randomly sample 1% of the men and 10% of the women, you'd end up with 1k men and 1k women. If the gender-wise distributions of ability are equal, then those two groups ought to be indistinguishable short of minor sampling noise, no? If you have taken such proper statistical courses, then maybe you could tell me what is wrong with such methods and what the need would be to attack the problem from such a convoluted manner as they do, when they have far simpler methods (e.g. taking the mean of both distributions, applying a X2-test, and calling it a day) at their disposal? The study is legit and has been successfully defended a number of times, and the formulas used to check out the conclusions hold up (check appendix A). At this point, if you are going to argue with science then go right ahead, but I will laugh at you. :) I don't know what these successful defenses are. I can't find any rebuttals to https://www.ncbi.nlm.nih.gov/pmc/articles/PMC2894898/, which seems to point out several rather large flaws in the study's methodology: What these authors did not mention, however, is that their model predicts a rating of 3031 for the best male German player and a rating above 2700 for the 16 best male German players. Currently, there are only 33 players in the world with a rating above 2700 and there is no German belonging to this elite group. The highest rating ever achieved by a human player is 2851, which is significantly lower than the expected rating of 3031 predicted for the best German player according to the model of Bilalić et al. (2009). Therefore, this model seems inadequate to describe the upper tail of the distribution of ratings of German chess players. For what it's worth, that also seems to use a needlessly convoluted methodology, although one which ends up making the same predictions (e.g. linear model with slope equal to representation difference should fit) as mine. As for women soccer, well, there are a ton of improvements happening already and as time move on, things are bound to get better. :) Do you have any sources for this? Assuming no or at least fewer improvements happen in normal soccer, that should imply female win rate in mixed matches approaches 50% as time goes on. I can't actually find any statistics on mixed matches, since they're not held often. But based on other sports, we can guess that if the win rate were anything close to 50%, so that it would be possible to engineer such a match that appears fair at first glance and that gives the girls a good chance at winning, then such a match would indeed be engineered in order to "prove" that women's soccer is in fact a legitimate sport. Since no such matches have been engineered and the only mixed matches we hear about are national teams getting curb-stomped by obscure regional teams' youth divisions with players missing, we can deduce that this is not the case, and that any improvements would have been utterly insignificant and presumably will continue to be so. Or, sure, you could claim that things will sharply get better in the future, but as they say. extraordinary claims require extraordinary evidence. Further circumstantial evidence for this can be found in the extremely contrived reasons given for why the WNT should not play the national team. Since they can't be taken at face value but the view itself appears to be strongly held, you can draw the conclusion that there's some other reason for it that they don't want to share. And the only such reason I can come up with is that such a match would permanently shatter any delusions of women being even halfway decent at soccer, which would be a politically uncomfortable position to be in. There was a certain photograph about which you had a hallucination. You believed that you had actually held it in your hands. It was a photograph something like this. |
| wertigon |
Posted on 19-06-27, 16:25
|
|
Post: #69 of 205
Since: 11-24-18 Last post: 303 days Last view: 3 days |
Actually, your reasoning is not correct, and the same can be said for Knapp. The criticism of Knapp is threefold. The first is that the maximum theoretical player does not have the expected score of the real world player. This may seem relevant, but since the error is *uniform*, it does not matter for the intended purpose, which is to show that simple statistics make up the absolute majority of the explanation. The second problem is that he questions the assumption that given a large enough dataset, each individual sample will fall within a bell curve. I do not see how this assumption is even questionable, any and everyone who has ever taken a statistics course knows this is the truth. The keyword being large enough dataset. The third and final problem is the same trap you fall in; This is not a linear model. It is an exponential model. That is what you need all those complex calculations for. Again, you are clearly not a statistician, else you would've understood this. It is taught in the first college-grade statistics course. If you want to do more reading look up the official method in this book: Order Statistics, Herbert A. David, Haikady N. Nagaraja, ISBN: 0471654019 Regardless, what Belalic did was prove that there is a statistical model that, when crunched with real numbers data, holds up. The model also explains the gender gap to 96% accuracy. ----- As for women soccer games, why should they be able to beat men in order to provide an entertaining game? |
| Duck Penis |
Posted on 19-06-28, 21:27
|
|
Stirrer of Shit
Post: #446 of 717 Since: 01-26-19 Last post: 1910 days Last view: 1909 days |
Posted by wertigon The error isn't uniform at all:  Furthermore, it doesn't look like a "random noise" kind of error, but rather a "horribly broken model" kind of error. So it's definitely a relevant criticism. The second problem is that he questions the assumption that given a large enough dataset, each individual sample will fall within a bell curve. I do not see how this assumption is even questionable, any and everyone who has ever taken a statistics course knows this is the truth. The keyword being large enough dataset. I believe you're thinking of the central limit theorem. It makes no predictions with regard to the number of samples, but rather the number of variables. For Elo ratings, it's a reasonable criticism. Posted by https://en.wikipedia.org/wiki/Elo_rating_system#Most_accurate_distribution_model Anyway, by my understanding you'd just end up forcing it to a normal distribution, and the inaccuracies would just end up as a lowered predictive value (e.g. noise) which shouldn't have any systematic effects on the ranking. Maybe it would break the ridiculously complex formulae if he did get it wrong though. The third and final problem is the same trap you fall in; This is not a linear model. It is an exponential model. That is what you need all those complex calculations for. Again, you are clearly not a statistician, else you would've understood this. It is taught in the first college-grade statistics course. If you want to do more reading look up the official method in this book: It is considered customary to tell the reader at which page the citation is to be found. You would not be so kind so as to bestow upon me your advanced statistical education, would you? I don't know what exactly is an exponential model here. I don't think the 2009 study's is, according to figure 3 they model the expected performance of the best performers with what looks decidedly logarithmic. A linear model does seem perfectly reasonable for the correlation of the internal rankings in a smaller sample drawn from a larger sample and the rankings of the items in the smaller sample computed taking into account the entire sample. You can model it yourself in Excel. Paste in the following in an empty sheet on A1 through F1: Drag down to D1000. Then do a correlation graph of E and F. Looks pretty linear, no? Regardless, what Belalic did was prove that there is a statistical model that, when crunched with real numbers data, holds up. The model also explains the gender gap to 96% accuracy. Sure, but that isn't very hard to do with the definition of "explain" and "accuracy" used in the paper: Averaged over the 100 top players, the expected male superiority is 341 Elo points and the real one is 353 points. Therefore 96 per cent of the observed difference between male and female players can be attributed to a simple statistical fact—the extreme values from a large sample are likely to be bigger than those from a small one. 351/341 = 96.6%, which they round down to 96%. (a serious model might have used R2 to estimate the fraction of variance explained, for comparison) With that definition, I could obtain a model which explains 100% of the gender gap without using any complicated statistical methods: Model the score distribution for women as a normal distribution with μ = 1350 and σ = 350. Model the score distribution for men as a normal distribution with μ = 1650 and σ = 350. Compute the gender gap as μm-μf. As for women soccer games, why should they be able to beat men in order to provide an entertaining game? No reason, my point was just that they were intrinsically inferior at it. It could still be entertaining, just like how people watch children's sports (well, at least when it's their kids playing) and find it entertaining, but this doesn't put children on equal footing with adults. There was a certain photograph about which you had a hallucination. You believed that you had actually held it in your hands. It was a photograph something like this. |
| wertigon |
Posted on 19-06-29, 14:20
|
|
Post: #70 of 205
Since: 11-24-18 Last post: 303 days Last view: 3 days |
Is the study perfect? No, of course not. But both you and Knapp have not understood the argument that is made. The argument being presented is, given the top 100 men and the top 100 female chess players, there is a skill difference that is proportional to the number of men and number of women playing chess. This is then backed up with a model that predicts ELO and subsequent skill gap based on the number of people in both pools, in a theoretical scenario. This is then compared with real world data, and concludes that there was a 96% correlation (on average) for this particular data set. If run on another set, it provides a similar outcome. Conclusion: The gap is mostly due to few women participating in chess, not due to women being inferior to men. Note that what was measured and predicted here, is the difference in skill, not ELO as such. This difference is also assumed to follow a bell curve (but ELO in and of itself isn't). The model subsequently calculates what the n:th person of a certain pool should have as skill gap, vs what the n:th person of a different larger pool have. Or in other words: The n:th player in Pool A of size K has ELO x. The n:th player in Pool B of smaller size L then should have ELO y. Difference in skill should be z. Let's check by plugging in the values for the first 100 in pool A and B. Oh look, real world data matches the predictions by an average of 96% (worst case 80+%)! At this point you're arguing facts. You don't happen to believe the world is flat and the moon landing is a big hoax either, do you? :) |
| Duck Penis |
Posted on 19-06-29, 17:04
|
|
Stirrer of Shit
Post: #448 of 717 Since: 01-26-19 Last post: 1910 days Last view: 1909 days |
>Is the study perfect? No, of course not. But both you and Knapp have not understood the argument that is made. >The argument being presented is, given the top 100 men and the top 100 female chess players, there is a skill difference that is proportional to the number of men and number of women playing chess. Well, the skill difference is a function of the relative under-representation of women among chess players; it's not a linear model. Nitpicks aside, I understand the argument being made full well. >This is then backed up with a model that predicts ELO and subsequent skill gap based on the number of people in both pools, in a theoretical scenario. They present a model, at least. >This is then compared with real world data, and concludes that there was a 96% correlation (on average) for this particular data set. If run on another set, it provides a similar outcome. You've misread it. Nowhere in the paper do they claim a 96% correlation. Here are all occurences of the string "96" in the paper body: Although the performance of the 100 best German male chess players is better than that of the 100 best German women, we show that 96 per cent of the observed difference would be expected given the much greater number of men who play chess. and higher participation rates of men (Charness & Gerchak 1996; Chabris & Glickman 2006) Our approach is based on the work of Charness & Gerchak (1996) the estimate of the extreme value from a sample tends to be highly variable (Glickman & Chabris 1996; Glickman 1999). Averaged over the 100 top players, the expected male superiority is 341 Elo points and the real one is 353 points. Therefore 96 per cent of the observed difference between male and female players can be attributed to a simple statistical fact we have the recurrence relationship (Harter 1961) The second-to-last quote is the only one which has anything explaining how they came up with the 96% figure. The word "therefore" in the sentence "Therefore [sic] 96 per cent of the observed difference between male and female players can be attributed to a simple statistical fact" ought to refer back to the previous sentence, "Averaged over the 100 top players, the expected male superiority is 341 Elo points and the real one is 353 points," and the only way to arrive at that figure from that clause is by computing 341/353 (0.966) and then rounding down. This isn't a correlation. In fact, the term is used only once in the whole paper: The rating itself is based on the same assumptions as the Elo rating used by the international chess federation. The two correlate highly (r=0.93). > Note that what was measured and predicted here, is the difference in skill, not ELO as such. This difference is also assumed to follow a bell curve (but ELO in and of itself isn't). The model subsequently calculates what the n:th person of a certain pool should have as skill gap, vs what the n:th person of a different larger pool have. >Or in other words: The n:th player in Pool A of size K has ELO x. The n:th player in Pool B of smaller size L then should have ELO y. Difference in skill should be z. Let's check by plugging in the values for the first 100 in pool A and B. Oh look, real world data matches the predictions by an average of 96% (worst case 80+%)! Not quite sure I follow. The paper deals with differences in Elo rating and nothing else. See for instance the Y axis of the second graph. My question then is why such a complicated formula is needed. Shouldn't the nth highest ranked player in pool B of size L have the same Elo score as someone with rank (K/L) in pool A, if A and B have the same mean and variance, regardless of what distribution they would obey? Anyway, the real-world data does not match the predictions by "an average of 96%". It would be more accurate to say that the average of the real-world data matches the average of the predictions by 96%. As I am sure you know, this is not the same thing. >At this point you're arguing facts. You don't happen to believe the world is flat and the moon landing is a big hoax either, do you? :) The only facts at play here are the Elo databases' scores, which I have not disputed. The rest are conclusions, which may be either right or wrong. Here's a far simpler analysis: 1) download the same database they used from https://dwz.svw.info/services/files/export/csv/LV-0-csv.zip 2) open spieler.csv in Excel 3) cut off the zero-scorers at the bottom (optional) 4) in O2 punch in "=IF(E2="M",IF(F2="D", I2, ""),"")", in P2 "=IF(E2="W",IF(F2="D", I2, ""),"")", double-click on O2 and P2. 5) enter in some cells "=MEDIAN(O:O)," "MEDIAN(P:P)," and "=MEDIAN(O:O)-MEDIAN(P:P)" and find that, for German players, the median male score is 1560 while the median female score is 1254 (gap = 306) This should take you around two minutes to do, and completely falsifies their explanation which took four people what looks like a few months to come up with. Yet that study got published, and this is just a throwaway post on an obscure forum. See, this is why I don't Fucking Love Science™ one bit. It's all a god-damned fraud, that they use big words to claim it provides some kind of value to society. The only reason why you'd want to go to school is either for entertainment or for the degree. Which, mind you, are both perfectly valid reasons, but it's hardly something to be proud of, and certainly not worth $30k a year or whatever Americans spend on it. If they'd have invested $120k in the stock market and spent four years messing with Perl, they'd have been far ahead of their peers. Yet people claim going to college makes you smart, or proves you're smart. Go figure. There was a certain photograph about which you had a hallucination. You believed that you had actually held it in your hands. It was a photograph something like this. |
| wertigon |
Posted on 19-06-30, 10:05 (revision 1)
|
|
Post: #71 of 205
Since: 11-24-18 Last post: 303 days Last view: 3 days |
Sigh... The model explains the skill gap to 96% on this particular dataset. Why can you not accept that? This is fact, proven by the paper. Now you are just arguing semantics, and trying to argue math to fit your world view. In essence, you are saying 2 + 2 = 5 if you squint look at it from a certain angle. That is not only dishonest and misleading, it is trying to warp the facts to your own world view. If this were a CO2 study, you'd be arguing there is no global warming because the model predicted this year would have an average temperature of 20 degrees celcius, while in fact it only had 19 degrees celcius. If this was a doctors prognosis, you'd argue cancer is harmless because your old man whom the doctors gave 6 months to live actually managed to live 18 months instead. Surely not even you is that ignorant? [edit] Aaaand your math still fails you. Article: The model predicts the difference gap between the n:th ranking male and n:th ranking female skill as a function of skill pool size and rank. Let X be the number of males available. Let Y be the number of females available. Let n be the rank we choose to look at (1 - best male vs best female, 50 - 50th best male vs 50th best female). Let's code it: Could you please point out which line of this algorithm is incorrect? [/edit] |
| Duck Penis |
Posted on 19-06-30, 12:23
|
|
Stirrer of Shit
Post: #449 of 717 Since: 01-26-19 Last post: 1910 days Last view: 1909 days |
Posted by wertigon It doesn't, I'm afraid. If it had a good fit, they would use the far more honest measure of R2. Since it doesn't, they resort to calculating another measure and trying to pass it off as a correlation. If this were a CO2 study, you'd be arguing there is no global warming because the model predicted this year would have an average temperature of 20 degrees celcius, while in fact it only had 19 degrees celcius. On the contrary. My issue isn't that their predicted gap is not exactly equal to the gap found in the data, but rather that they take this as evidence of their claims. If you compute it the way they did, the model could be wildly off for all the data points but still end up with an average close to the data's such. See below for such an example. [edit] With you so far. Let X be the number of males available. The last line, as it uses an incredibly poor not to say misleading definition of accuracy. Say for instance the "model" would just be this: I'm sure you would agree this is a very poor model. But it would give the same results - 96% or thereabouts. The proper way to do it would be something like this: There was a certain photograph about which you had a hallucination. You believed that you had actually held it in your hands. It was a photograph something like this. |
| wertigon |
Posted on 19-06-30, 17:17 (revision 2)
|
|
Post: #72 of 205
Since: 11-24-18 Last post: 303 days Last view: 3 days |
Ok, you have the model, you have the data, go nuts. Prove him wrong. :) Protip: It's built in to the model. Also, seems you have confused accuracy and causation. |
| Duck Penis |
Posted on 19-06-30, 19:32
|
|
Stirrer of Shit
Post: #450 of 717 Since: 01-26-19 Last post: 1910 days Last view: 1909 days |
Posted by wertigonI did, two posts ago: for German players, the median male score is 1560 while the median female score is 1254 (gap = 306) This could hardly be caused by any outliers, now could it? Protip: It's built in to the model. What is? Also, seems you have confused accuracy and causation. How? There was a certain photograph about which you had a hallucination. You believed that you had actually held it in your hands. It was a photograph something like this. |
| wertigon |
Posted on 19-06-30, 21:20 (revision 1)
|
|
Post: #73 of 205
Since: 11-24-18 Last post: 303 days Last view: 3 days |
Posted by sureanem Ah, no, sorry. You used a different model, that's not how this works. See: 1. We have a machine which uses a model that claims to do a specific thing. 2. When tested versus real world data (albeit a specific dataset) using a testable and repeatable method, the model is proven to have a 96% accuracy. 3. You now say the results do not count, because that is not how you measure accuracy. Fair enough. 4. Please provide proof. With the same model, using the same method, please display your results, as well as calculating your coefficient of determination. It should take you perhaps half an hour to an hour with the tools at your disposal. Since you are the one claiming this study is a fraud, the burden of proof is on you. :) |
| Duck Penis |
Posted on 19-06-30, 23:37
|
|
Stirrer of Shit
Post: #451 of 717 Since: 01-26-19 Last post: 1910 days Last view: 1909 days |
OK, challenge accepted. Going to rename c1 and c2 to Magic1 and Magic2, since C1 and C2 are cells, approximate H(x) by ROUND(Gamma+ln(x)), and for σ and μ calculate those on basis of the players with Elo > 0. This gives the expected ranking diff for pair number Count as Now, these FACT expressions cause Excel to overflow big time, so we replace them with Stirling's approximation, and compute the whole expression as a logarithm: n! / (n-k)! * n^k ln(n!) - ln((n-k)! * n^k) ln(n!) - (ln((n-k)!) + ln(n^k)) ln(n!) - (ln((n-k)!) + k*ln(n)) n! ~= sqrt(2*pi*n)*(n/e)^n n! ~= (2*pi*n)^0.5*(n/e)^n ln(n!) ~= ln((2*pi*n)^0.5*(n/e)^n) ln(n!) ~= ln((2*pi*n)^0.5)+ln((n/e)^n) ln(n!) ~= 0.5*ln(2*pi*n)+n*ln(n/e) ln(n!) ~= 0.5*(ln(2)+ln(pi)+ln(n))+n*ln(n)-ln(e) ln(n!) ~= 0.5*(ln(2)+ln(pi)+ln(n))+n*ln(n)-1 substituting back into the previous expression: 0.5*(ln(2)+ln(pi)+ln(n))+n*ln(n)-1 - 0.5*(ln(2)+ln(pi)+ln((n-k))+(n-k)*ln((n-k))-1 + k*ln(n)) and back to Excel: And back again: And to get the difference: Unfortunately, this function doesn't compute. I don't think there are any errors in it, but I get the #NUM! error, which is about as descriptive as it sounds: https://support.office.com/en-us/article/How-to-correct-a-NUM-error-F5193BFC-4400-43F4-88C4-8E1DCCA0428B But I would think the most likely explanation is it doesn't like big formulae. Because the individual results pop up in the function inspector, except for some of them, like ROUND(Gamma+LN(Rank-1)) which sometimes gives #NUM!, and sometimes different values. Not always the same, which seems like a bug in LibreOffice. On another note, opening that spreadsheet now causes LibreOffice to hang. (If you can get that function to run in real Excel, please post your results. All you have to do it rename the cells and paste. Count_F is ~6k, Count_M ~60k, and Rank is just a counter from 1 to 100) Instead, we shall have to eyeball it from the graph provided in figure 3. From n=0..20 it looks about flat at 275. Then linear up to 425 at 100. Unfortunately, since the values for N have changed with the male superiority now being even higher, this doesn't work. So you'd have to actually run the function. In want of this, we can just take a look at figure 3 and notice that it looks extremely close to a linear trend line. And if we use such a trend line, it looks about the same as in their study: 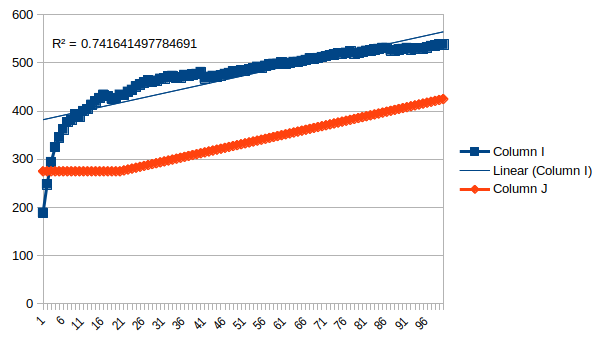 R-squared of 0.74, and perhaps more importantly we can observe the same thing in the paper: this is clearly not the right regression to use. If I just put in random trend lines, "Power" gets a r2 of 0.92, and actually tracks the only prominent feature in the graph. This is not to say that power is appropriate, but if a random regression model from Excel has a stronger predictive power than your model you should probably rethink your life. Now let's see what the ordinary hypothesis (e.g. women are worse at chess) would predict, using parameters from the data: nm = 58301 nf = 3666 σm = 335 σf = 364 (!) μm = 1594 μf = 1335 Surprised about the standard deviation, women IQs have less variation than male such. But this might be a function of the odd cutoff effects in the sample. Anyway,  Follows the shape much better, R2 = 0.87. Overpredicts the gap though. This might be of the range restriction effects, which seemed to take far more women out of the sample than men. Probably someone with an actual degree could redo this with fancier software, but it stands to reason that the study is an utter fraud. Why else would you use so complicated methods that they can't even run in Excel? There was a certain photograph about which you had a hallucination. You believed that you had actually held it in your hands. It was a photograph something like this. |
| wertigon |
Posted on 19-07-01, 06:14 (revision 2)
|
|
Post: #74 of 205
Since: 11-24-18 Last post: 303 days Last view: 3 days |
So with your own calculations you find that the mean R² is about 0.74. This means in your own words that the model explains for 0.74 proving, at the very least, that there is a strong correlation between pool size and skill gap. Thank you! :) |
| Duck Penis |
Posted on 19-07-01, 13:26
|
|
Stirrer of Shit
Post: #454 of 717 Since: 01-26-19 Last post: 1910 days Last view: 1909 days |
Posted by wertigon Not the mean R2, just the R2. What does the second sentence mean? That the high R2 proves the model is accurate, even if it happens to perform worse a model which does take into account the skill gap? 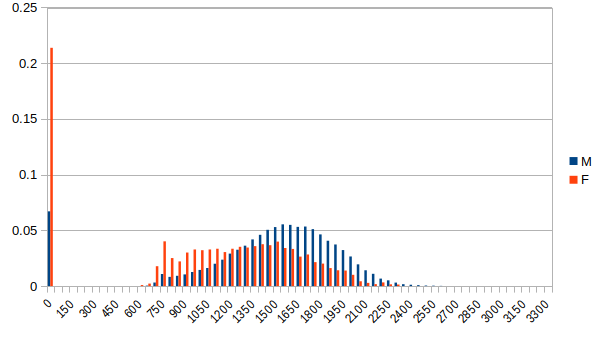 (X = Elo binned in groups of 50 points, Y = share of population in bin) There was a certain photograph about which you had a hallucination. You believed that you had actually held it in your hands. It was a photograph something like this. |
| wertigon |
Posted on 19-07-01, 19:19 (revision 1)
|
|
Post: #75 of 205
Since: 11-24-18 Last post: 303 days Last view: 3 days |
Posted by sureanem Wait, really? You have no idea at all what R² actually means, just that you need to calculate it? ROFL... It says clear as day the correlation between pool size and skill gap is 86.1%. Oh, and your "other hypothesis"? Women are worse at chess? Yes, this is already a fact. What is your explanation to this? That women inherently are worse at chess? Nope, not holding up according to multiple studies. And yeah, there's a reason I prefer MATLAB (actually Octave) or Numpy over shitty, shitty excel. :) |
| Duck Penis |
Posted on 19-07-01, 20:43
|
|
Stirrer of Shit
Post: #455 of 717 Since: 01-26-19 Last post: 1910 days Last view: 1909 days |
R2 is fraction of variance explained, there's never any average calculated. So I don't see how "mean R2" is a meaningful term. You square each individual deviation from the model, then sum them all up and divide by the sum of deviations from the mean. The correlation is about 86%, sure, but what does this have to do with anything? Oh, and your "other hypothesis"? Women are worse at chess? Yes, this is already a fact. What is your explanation to this? That women inherently are worse at chess? Nope, not holding up according to multiple studies. Which "multiple studies"? The one you just linked doesn't seem to make predictions which hold up very well, and perhaps more importantly offers no explanation for the difference in means, which ought to be unrelated to how many they are. (If you've got any theories here, I'd be interested in hearing them, but it seems unlikely) That women are intrinsically worse at chess seems fairly reasonable to me. It's a well-known fact they have worse spatial intelligence, and according to some observers lower intelligence in general. Chess g-loads at 0.3, so it isn't super high, but I'd reckon visuospatial intelligence plays a higher role than e.g. verbal intelligence in it. And then it ought to follow women would be worse, which is also what the data shows. I don't see what evidence there is against this, other than cack-handed attempts to come up with some alternative explanation and then claim the field is closed for further study. And yeah, there's a reason I prefer MATLAB (actually Octave) or Numpy over shitty, shitty excel. :) Then perhaps you could use your expensive software then and calculate that expression I posted? There was a certain photograph about which you had a hallucination. You believed that you had actually held it in your hands. It was a photograph something like this. |
| wertigon |
Posted on 19-07-01, 22:36 (revision 1)
|
|
Post: #76 of 205
Since: 11-24-18 Last post: 303 days Last view: 3 days |
You still fail to understand the argument, or, indeed, the scientific method as a whole. Ok, one last time, let's examine. 1. Observation: There is a large skill gap between two groups A and B. 2. Hypothesis: The skill gap between a group A and a group B can be explained by the difference in pool size of the two groups. 3. Method: Create a statistically valid model that predicts the skill gap of group A and group B. Of each pair from the 100 best from each group, test whether or not the gap predicted is close to the actual gap for each pair. 4. Expected outcome: If the model is accurate, it should correlate very well to the real world results. 5. Result: The result shows the model has around 96% accuracy from the dataset, and a very strong correlation coefficient of around 86%. 6. Conclusion: The data suggests that the skill gap can mostly be explained by the difference in size, though the model should be tested on other, similar data for conclusive evidence. This is a scientifically sound method. The model is also scientifically sound and reasonable (it might not have been, but it does check out and is legit). Ergo, scientifically, the gap may be explained by the size of the pools rather than any single skill gap. Evidence currently suggest the model is correct. How do we disprove the model? By running it on other known factors, such as color of skin, country of origin, or preferred language. It is highly probable these will show similar results given the almost unanimous results found in this study, but yes, it could simply be a fluke. See... The scientific model assumes humans are flawed beings that make mistakes all the time. Therefore a good scientist asks themselves, did I make an error somewhere? This is of course exploitable by those who wish to drive an agenda. See, for instance, the smoking correlation with lung cancer. I have no agenda to push, but I am interested in the truth. And the truth says, all sweeping statements about gender, genetics or race are best left in the past, where they belong. Posted by sureanem The linked study I showed you lists them in section 4 paragraph 4. It's 9 studies listed there. Posted by sureanem Why? You can use octave and numpy yourself, they are free to use. If anything, excel is the expensive tool here. Thank you for proving you have no clue how the scientific model works or what it is about, nor that you have ever written an accepted academic paper. Good day to you sir, I'm finished here. :) |
| Duck Penis |
Posted on 19-07-02, 00:15
|
|
Stirrer of Shit
Post: #456 of 717 Since: 01-26-19 Last post: 1910 days Last view: 1909 days |
Posted by wertigon See, this is the part I am not so sure about. You can't claim it's a valid model solely on basis of the high R-squared values. A model that predicts a gap of 400 points for all players would get a similarly high coefficient of determination, but that would clearly be a rubbish model. A five-second look at the data shows it doesn't track it well at all, which ought to be a red flag. Not to mention the other issue: if differences in group size are the root cause, then how come the means are different too? The model provides no explanation for this observation. The linked study I showed you lists them in section 4 paragraph 4. It's 9 studies listed there. 6 of those are dead links save for Spelke (2005), Kerkman (2000), and the 2005 Harvard president speech (only accessible through archive.org). Spelke's study is the typical word salad that psychologists tend to produce, with absoulutely zero quantitative content. Going to skip the parts about infants since I don't know anything about that and haven't claimed so - it would make perfect sense that they develop in puberty, so let's roll with that. The metastudy makes quite a few logical leaps which underpin the argument: This problem may be illustrated by a specific example. Here, they completely avoid evaluating whether it could be the case of girls getting more of said coaching, and throw away quite a wide chunk of quantitative evidence. And again: Although high school calculus classes once drew more Considering it's a well-known fact that girls get higher grades relative to subject test scores (leaving aside the issue of schools optimizing for female performance, which definitely is interesting though), this seems like as unreasonable evidence to keep. That women perform worse under pressure is just a matter of common sense, so to say that they score worse on tests could very well be a matter of that. But it's hardly a robust explanation. I mean, you could rewrite this whole paragraph and draw an entirely different conclusion from the same data: The contrast between the performance of high school They then pull this tiresome rhetorical trick yet again: Because these conclusions depend on students’ scores The entire study consists of this. They start off by a priori assuming the proposition is false. Then they use this to throw out evidence which says otherwise, since it is known to be false. They then use whatever evidence they didn't discard to show the validity of the proposition, which vindicates their decision to throw out the opposing evidence. Kerkman's I can't find on sci-hub, so I can only read the abstract. I'm not sure what conclusion I'm supposed to draw from it: There were no sex differences in accuracy or response time on the possible rotation problems, but males were more accurate than females on impossible problems. Neither auditory nor visual interference affected accuracy. The alleged sex difference in mental rotation problems is largely due to the use of problems that are not actually mental rotation problems. Surely, men being able to solve some problems better than women and some equally well makes them better on average? The Harvard speech did get memory-holed. But it hardly supports your claims. Christ, the guy was fired for holding it. He suggested that the cause was due to higher variability. Which also sounds plausible, although this might just be because it's utterly unpalatable to suggest the means are different. This guy was President and he got fired for suggesting the variations differed, so imagine what'd happen to a lowly researcher who'd suggest the means did. Now, do you have any explanation for why women would score worse at chess on average? Or any actual studies to cite other than a tiresome Gish gallop? Why? You can use octave and numpy yourself, they are free to use. If anything, excel is the expensive tool here. Oh yeah, MATLAB is. Octave is free. Then again, so is LibreOffice Calc (in common parlance, Excel), and it's utter dogshit. Octave seems to have about the peculiarities LibreOffice does, but less crashing and less loading of data: How do you get it to load a csv file which contains both int and string values? There was a certain photograph about which you had a hallucination. You believed that you had actually held it in your hands. It was a photograph something like this. |
| CaptainJistuce |
Posted on 19-07-02, 06:11
|
|
Custom title here
 Post: #546 of 1169 Since: 10-30-18 Last post: 70 days Last view: 3 days |
 --- In UTF-16, where available. --- |
| wertigon |
Posted on 19-07-02, 08:00 (revision 1)
|
|
Post: #77 of 205
Since: 11-24-18 Last post: 303 days Last view: 3 days |
So far you've managed to prove that women are bad at chess because women are bad at chess. The model I have presented instead gives strong indications that women are bad at chess because it is a smaller pool size than men. So, the interesting question here is whether or not this model holds up to scrutiny. How do we test this? Well one obvious way would be to run the model on other groupings, such as: - Males vs Females in a different data set - Different nationalities/cultures et cetera. You do have the model as described, as well as the tools. Get it to work properly and then test it on different data sets. If it holds up, we should see similar results (~90+% accuracy and ~80+% correlation coefficient). If it does not, well, I'll eat my shoe. Deal? :) |
| Duck Penis |
Posted on 19-07-02, 12:03
|
|
Stirrer of Shit
Post: #457 of 717 Since: 01-26-19 Last post: 1910 days Last view: 1909 days |
It's easier to test the model on the same data set, isn't it? The model purports to explain why you've got so few women in the top 100, and says it's because you've got fewer women which then causes extreme effects at the tails. And let's say that's true, for the sake of argument. Now how could that possibly explain the difference in means or medians? There was a certain photograph about which you had a hallucination. You believed that you had actually held it in your hands. It was a photograph something like this. |